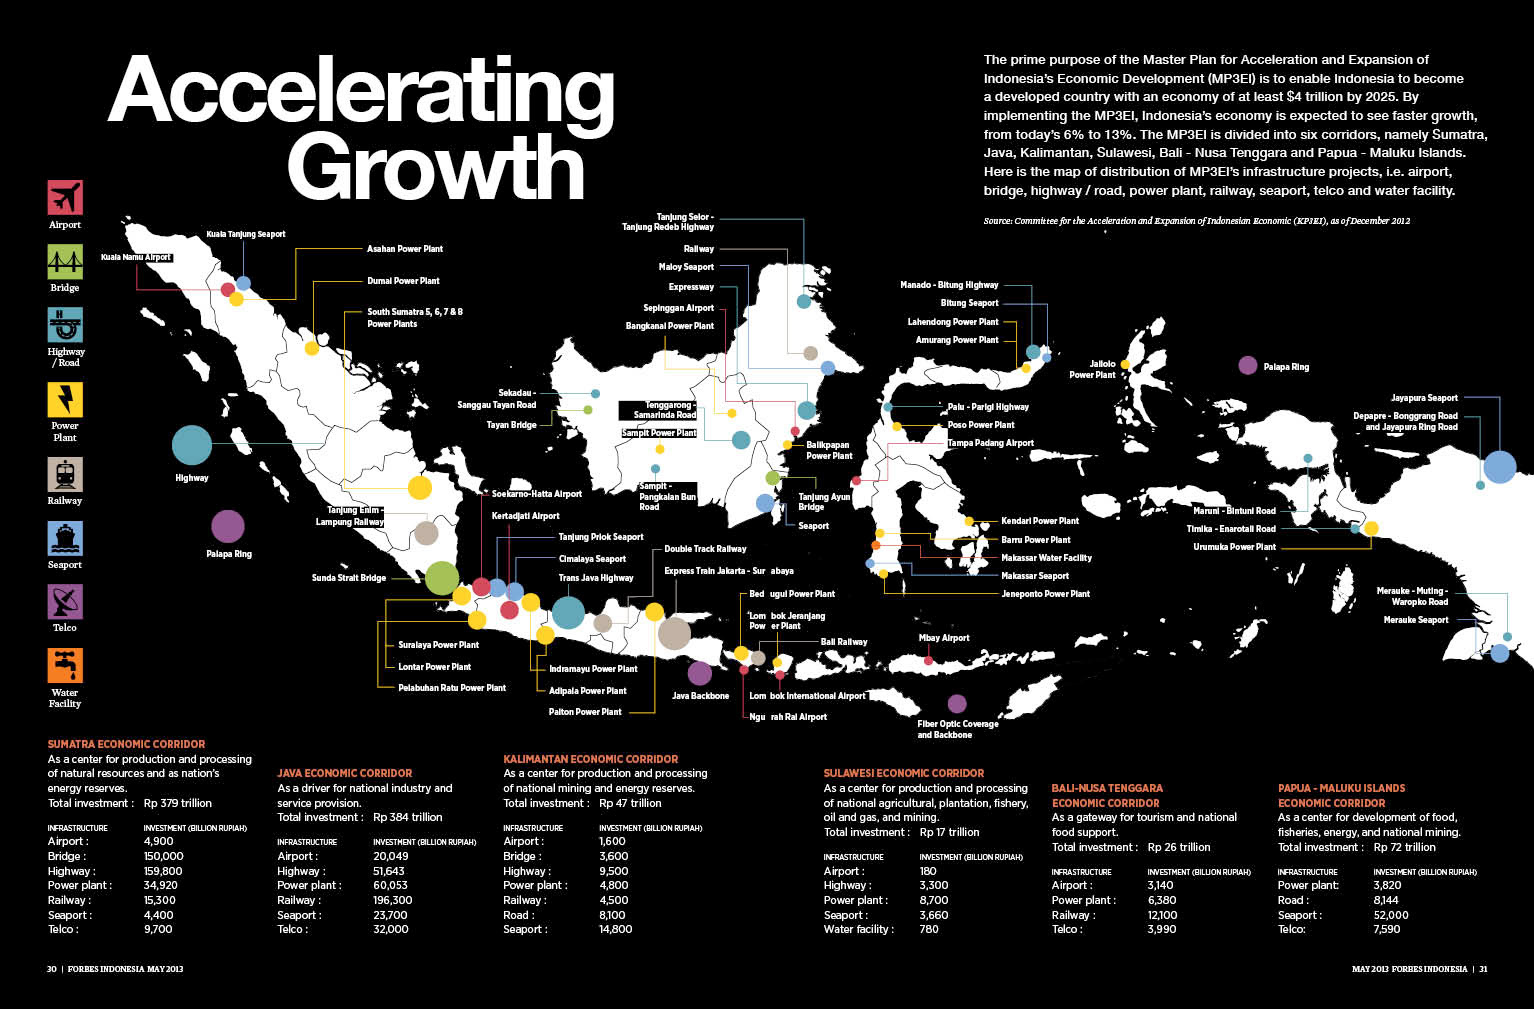
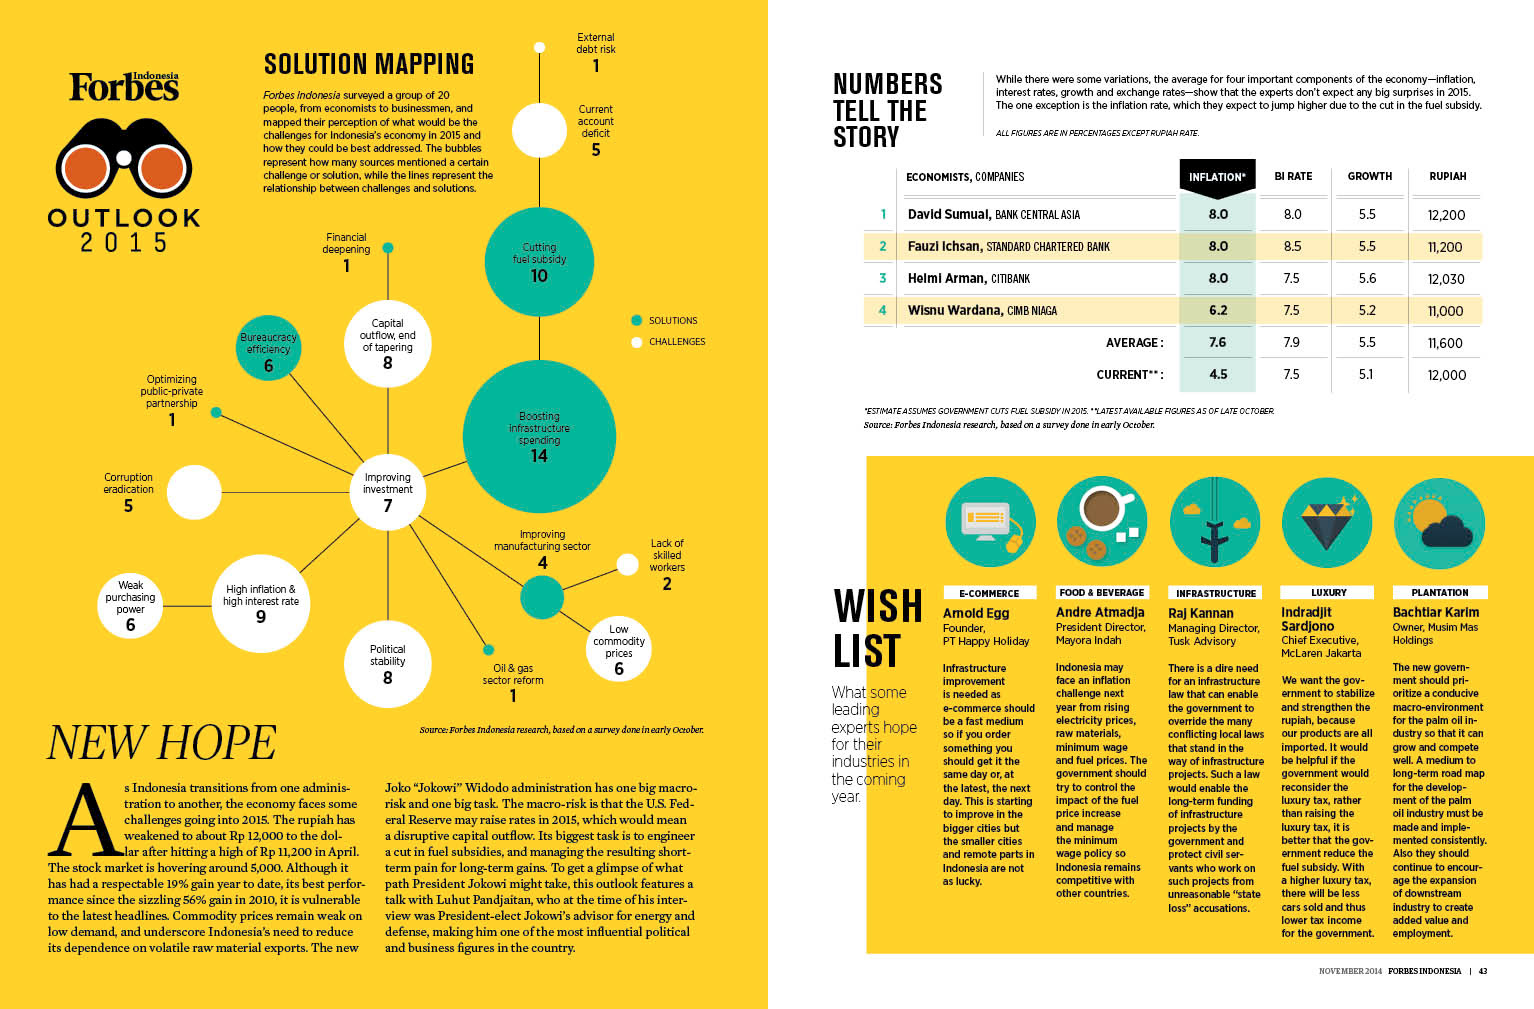
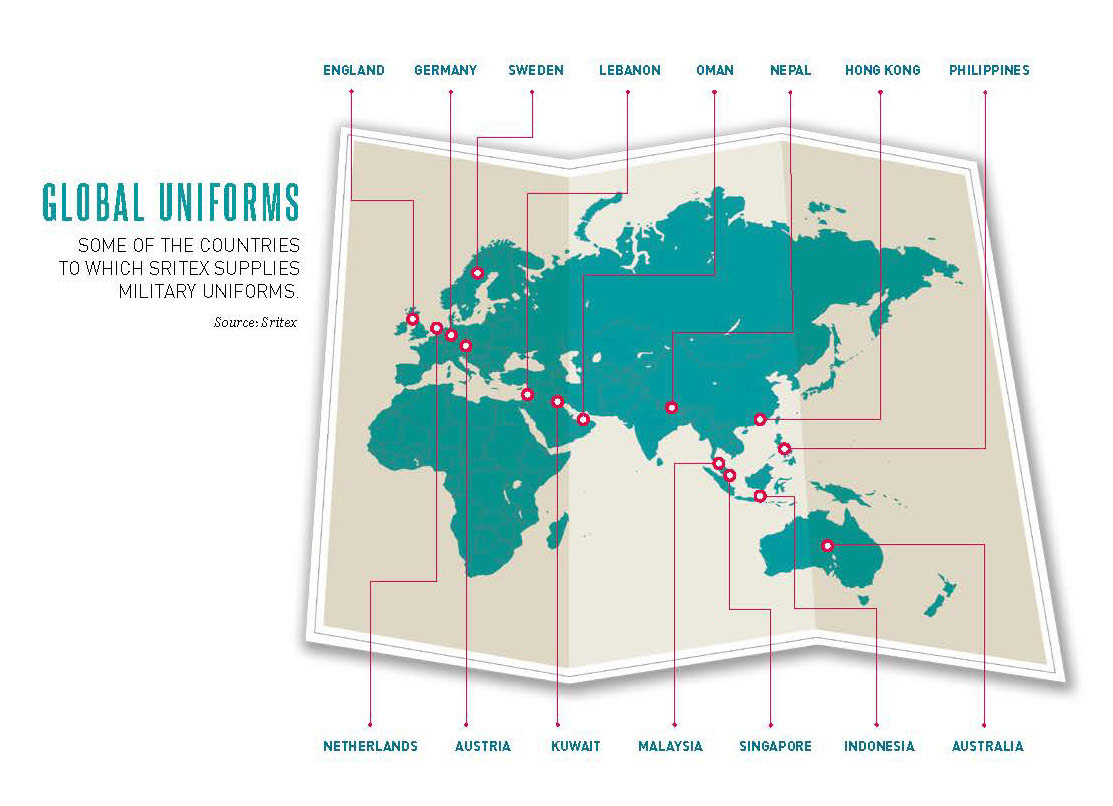
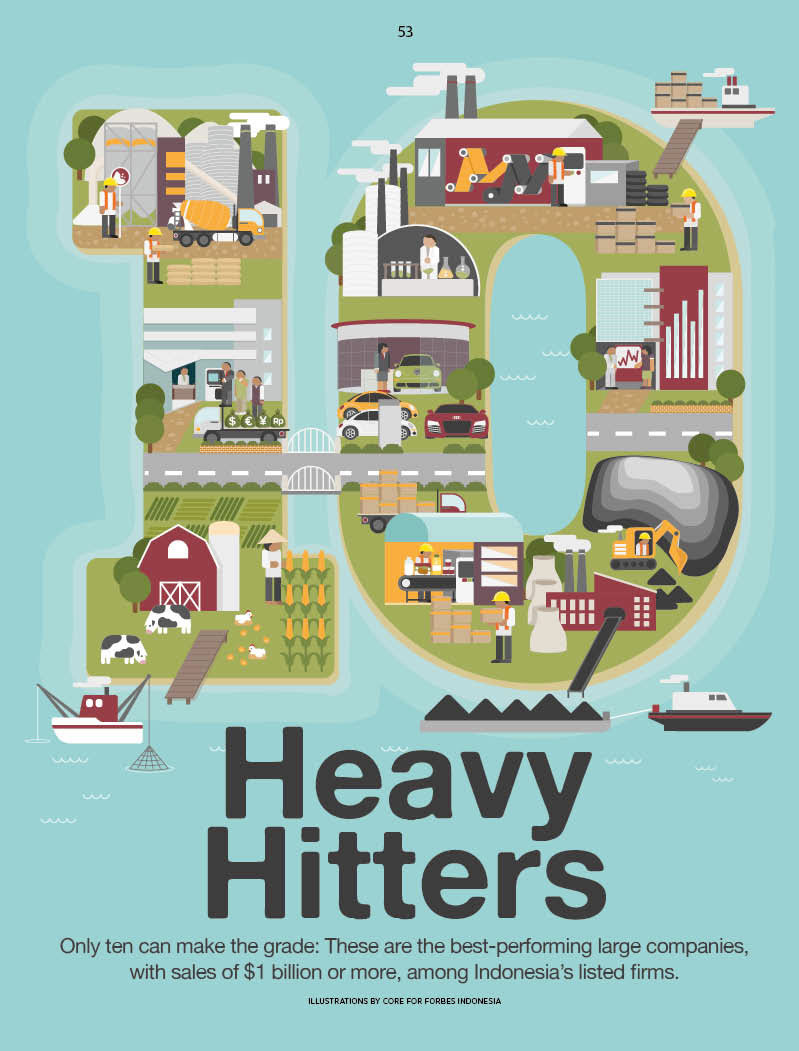
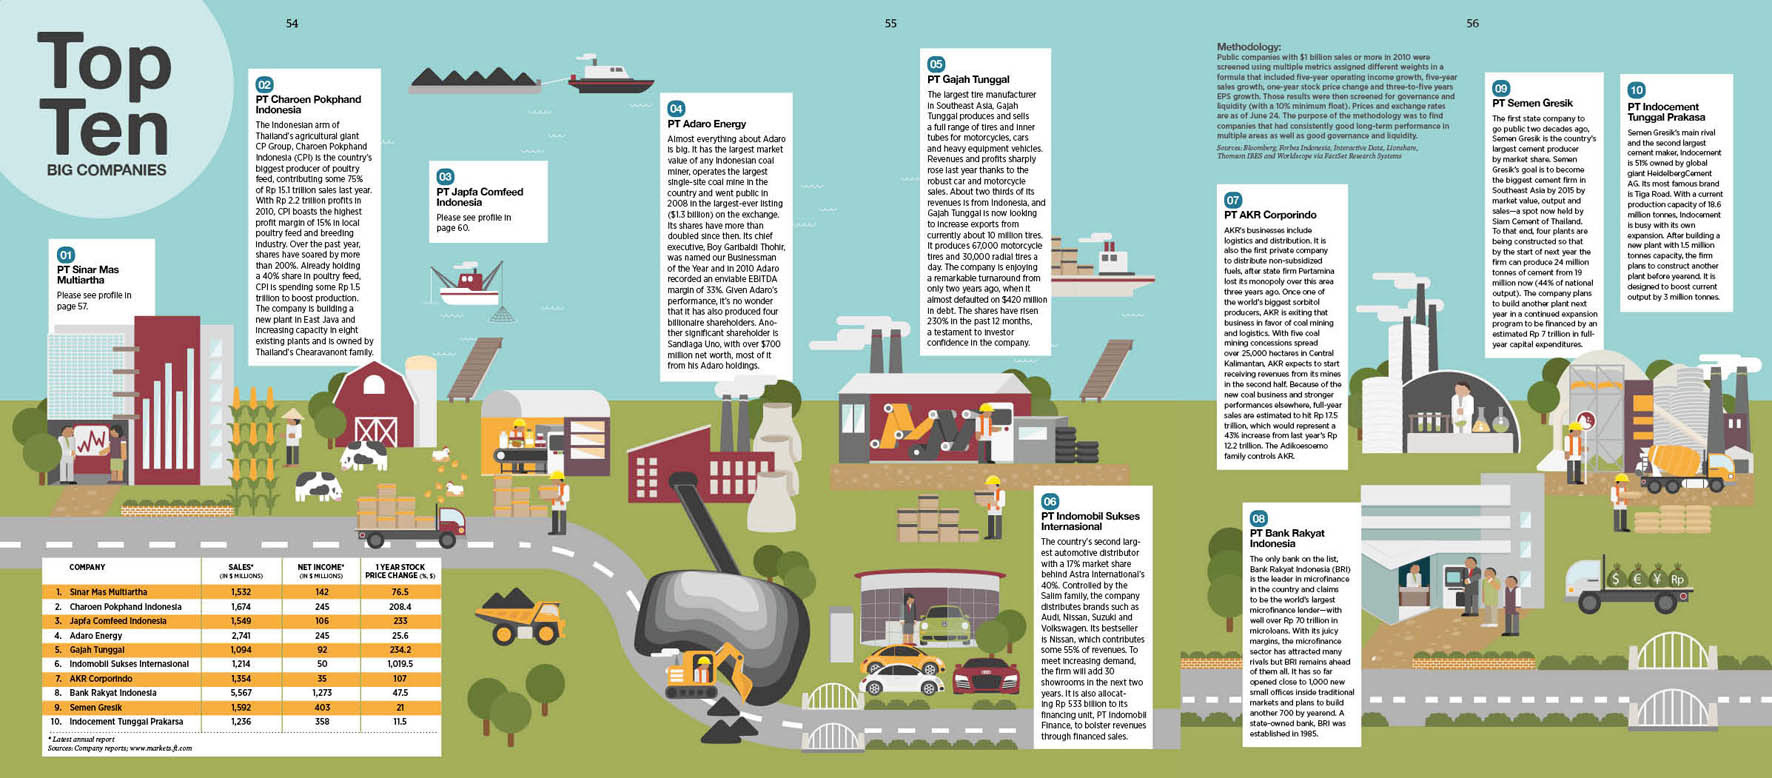
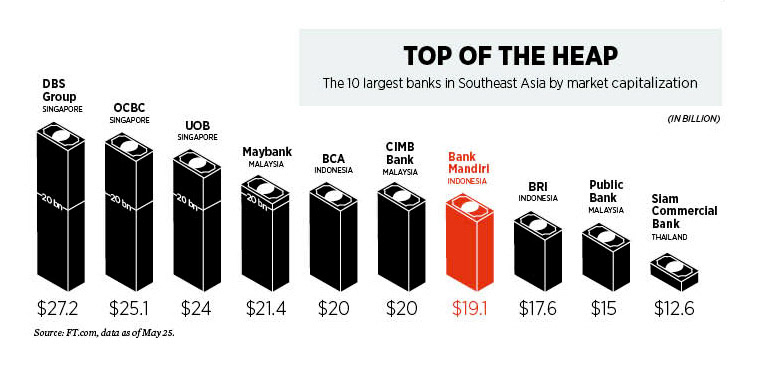
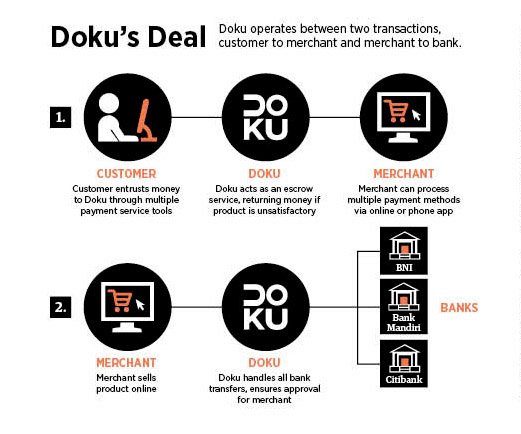
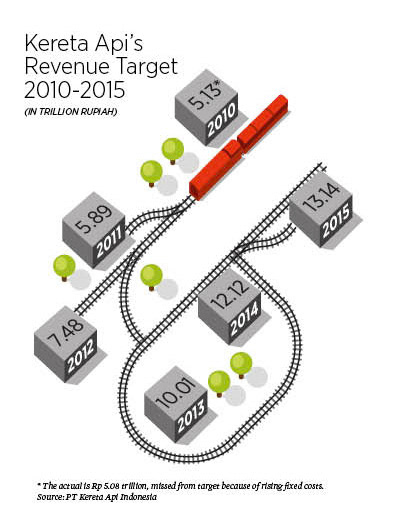
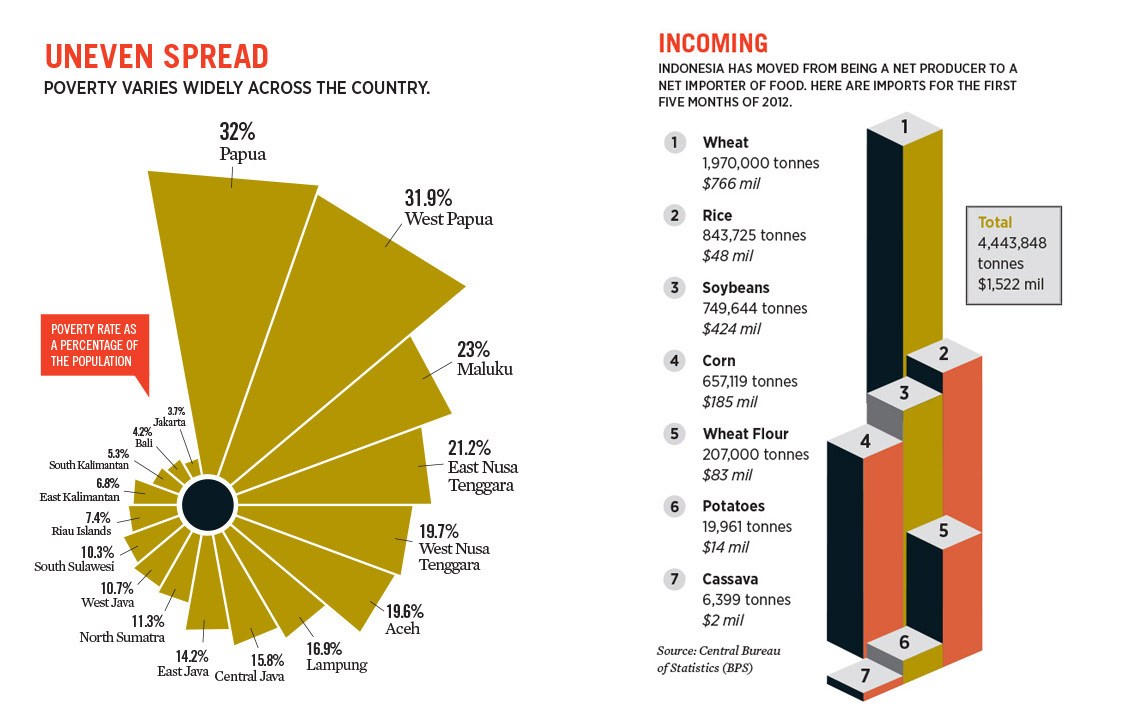
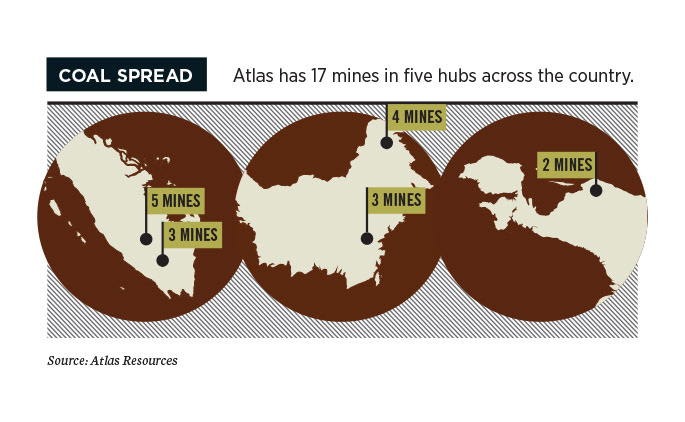
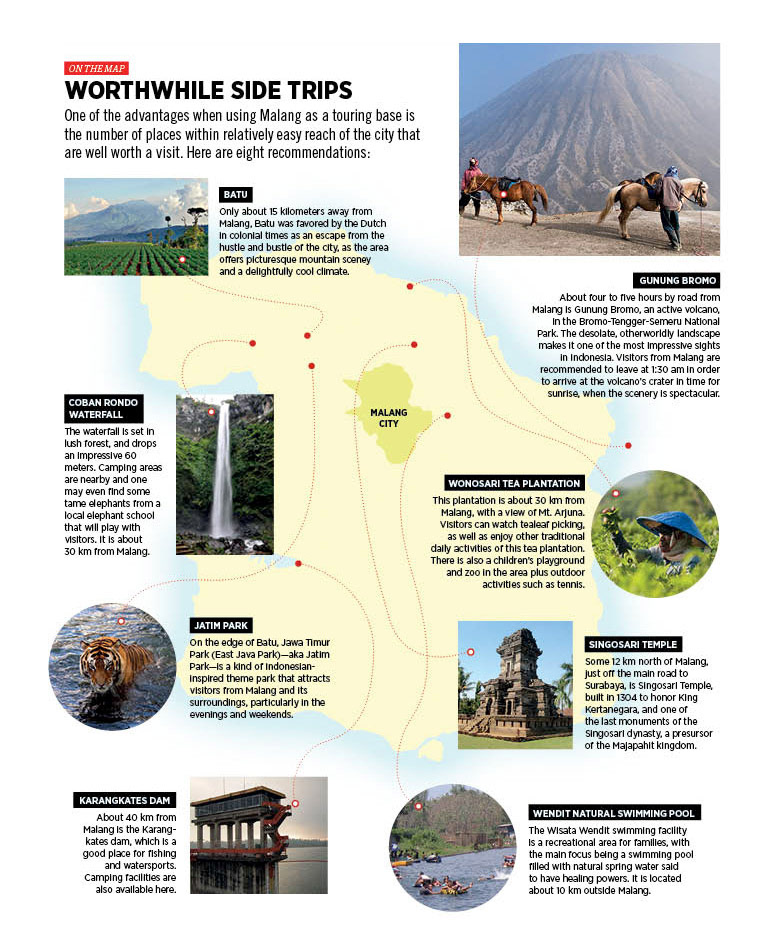
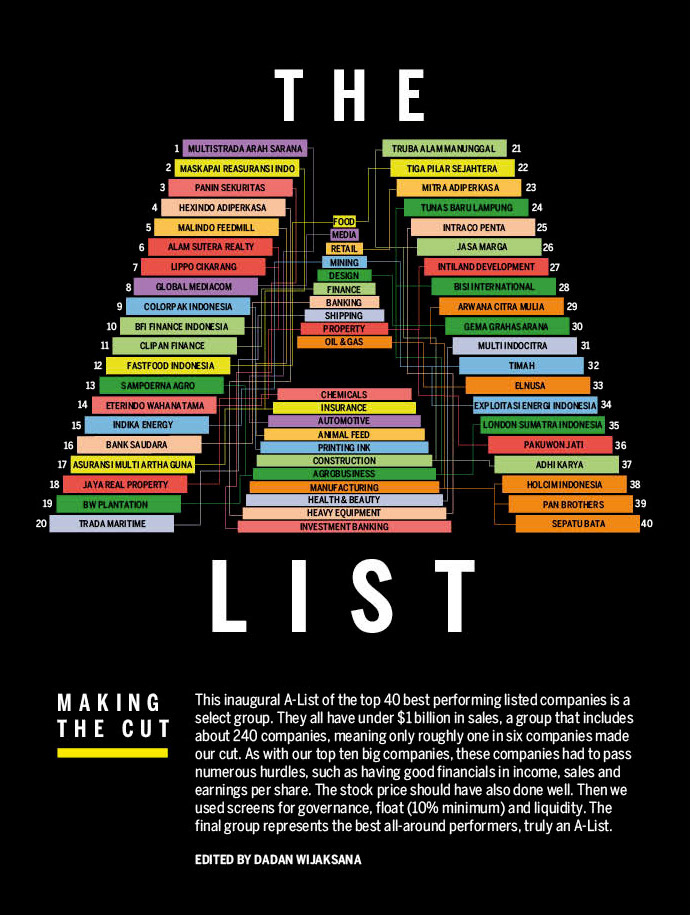
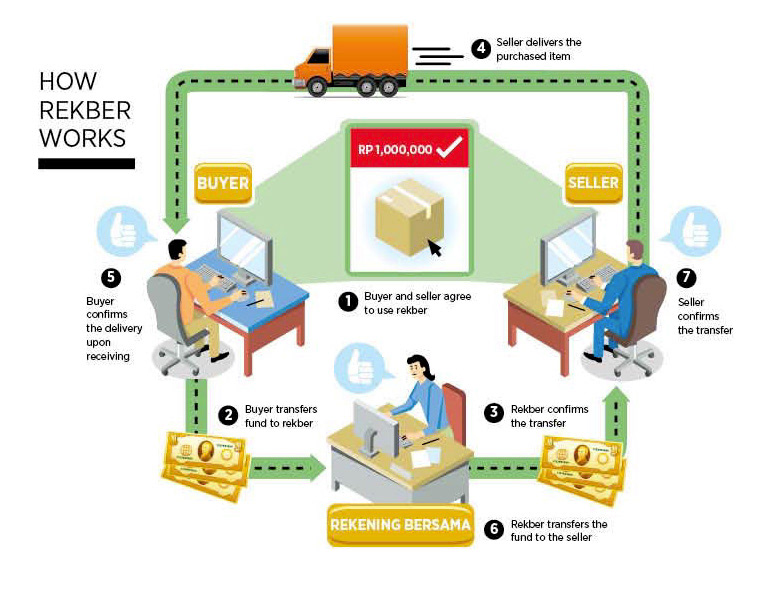
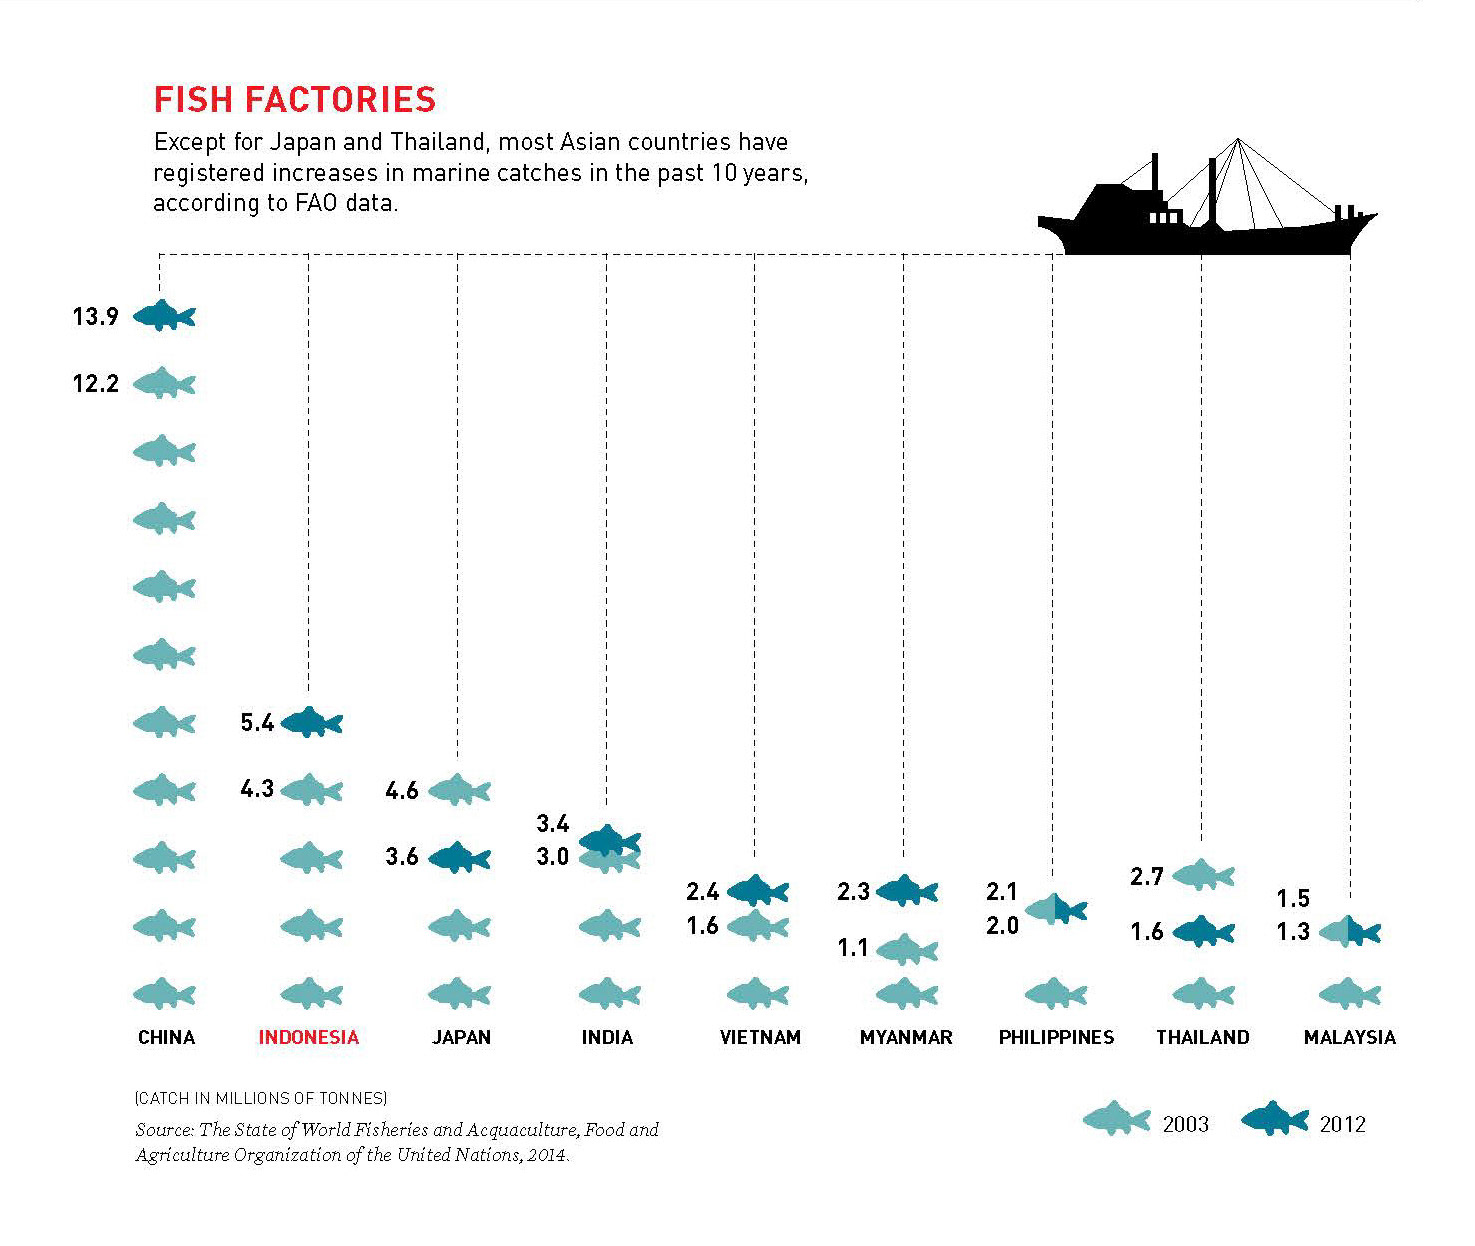
Selected data visualisations for the editorial content of Forbes Indonesia. Once I received the data from the editorial team, I sketched and translated the data into visualisations. In some of the works, I assigned illustrators and 3D designers to transform my sketch into an engaging and accurate visual. Almost in every edition of Forbes Indonesia (monthly basis) there were information data to be designed. The data ranges from business, finance, mapping, corporate structure, profits, production, etc.
Scope of work: Art director and data visualiser.